
![]()
What does systemic racism look like mapped onto our everyday lives? It looks like decades of housing, educational, banking/loan, transportation and employment inequity forced into being by the Federal government’s decisions about who gets to live in what neighborhoods.
Read Next City’s article, “How Redlining Segregated Philadelphia” and explore their interactive map based on the 1935-1940 Home Owners Loan Corporation Risk Maps. Take some time to experiment with the redlined map – it allows you to adjust the filters and view the map with today’s current household income, brownfields, high school graduation rates, crime and median house prices.
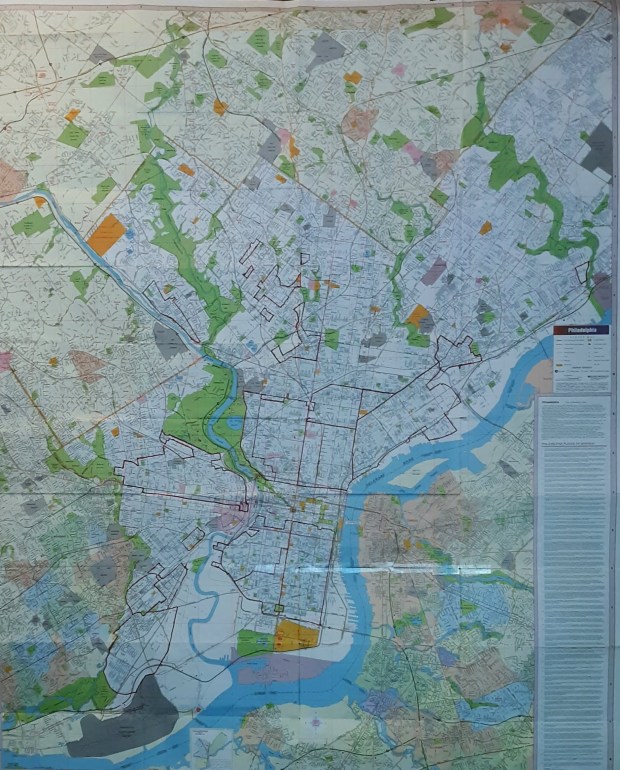
Below you will find photos of an old AAA map of Philadelphia. I’ve traced the HOLC red lines on the map with a Sharpie. I’m also traversing my way along the perimeter of the red lines, documenting the effects long term effects of redlining on neighborhoods. Because banks lend to Black and Latinx – mortgages and home improvement/equity loans – at a small fraction of the percentage they lend to White people, neighborhoods go through a physical decline…and often swift gentrification.
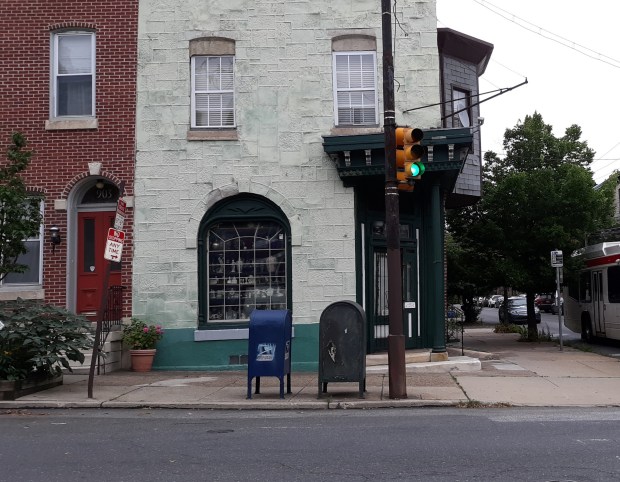
In this work in progress, as I physically trace the lines of demarcation and destiny across Philadelphia, I stop at intersections along the perimeter. I take a photo and document the intersection and place a sticker with a QR code leading to this page. I encourage viewers to explore one of the primary unseen structures that have determined the long-term well being of many of Philadelphia’s residents at the expense of others.
All photos on this page are available as 5″ x 7″ or 8″ x 10″ unframed prints.
- 5″ x 7″ prints: $35
- 8″ x 10 prints: $50
All profits from photo sales will go to the Philadelphia Women’s Community Revitalization Project. To purchase a photo, please email me at sculpturegrl@hotmail.com.

AAA Maps with Sharpie Redlines
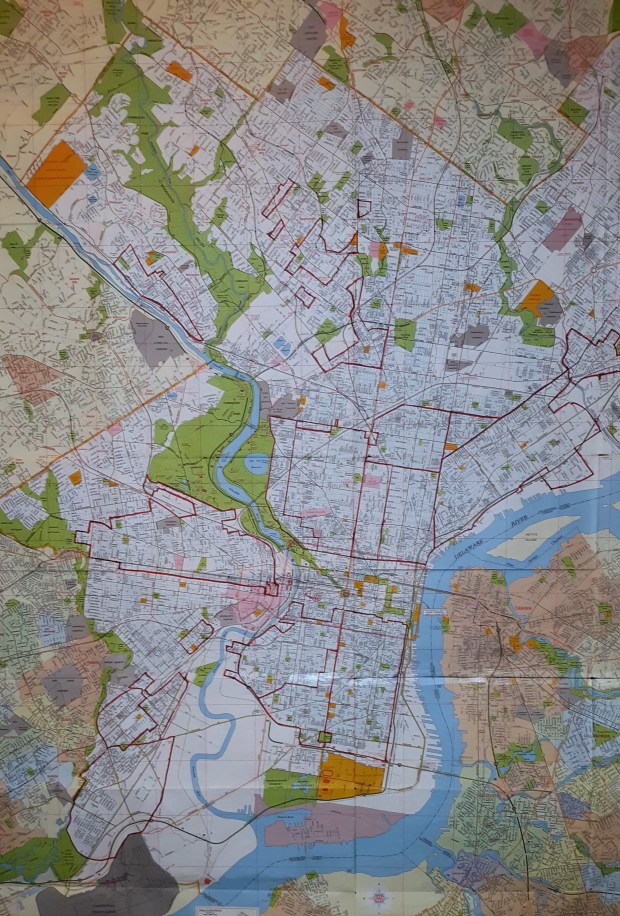
Philadelphia’s Redlines – areas considered “Hazardous” (from 1935-1940 HOLC Risk Map)
Philadelphia’s Redlines – areas considered “Hazardous” (from 1935-1940 HOLC Risk Map)


Photos
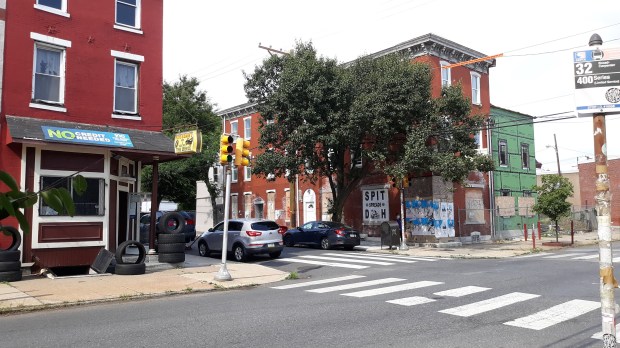
27th and Poplar Street, Brewerytown


33rd Street, Brewerytown


33rd Street, Brewerytown/East Park


Mander Playground, 33rd Street/East Park


Ridge Avenue and 33rd Street


Huntingdon Street and Ridge Avenue/Dell Music Center


Ridge Avenue and Lehigh Avenue/Mt. Vernon Cemetery


33rd Street and Lehigh Avenue


Lehigh Avenue and N. Napa Street
Dr. Ethel D. Allen School/Mt. Peace Cemetery/Sea of Death Memorial (In Memory of My People Murdered in Slavery)


30th Street and Lehigh Avenue/30th Street and Lehigh Avenue


29th Street and Lehigh Avenue/Calvary United Church


29th Street and Harold Street/Huntingdon Street


29th Street and York Street/Diamond Street


29th Street and Ridge Avenue


29th Street and W. Sedgley Avenue


29th Street and Glenwood Street


29th Street and Cecil B. Moore Avenue

29th Street and Oxford Street


29th Street and Jefferson Street


29th Street and Master Street


29th Street and Girard Avenue
29th Street and Poplar Street
